Welcome to the first edition of the FCS-FBS recap for the 2023 season. We will provide numerous graphs and statistics for all FCS versus FBS matchups that took place during the first full week of the college football season. In all, 42 FCS versus FBS games were played in the opening week. Any insights or nuggets of information will be in the opening paragraphs followed by the charts of each statistical category. A table has been provided below that allows the user to skip to a specific category instead of having to scroll through the tables. All the graphs below will have the same color scheme as FCS teams in orange and FBS teams in blue.
FCS Wins
Unfortunately, there were no wins for the FCS in week 1 of the 2023 season. The subdivision went 0-42 with only five games decided by 8 points or fewer. Here’s to hoping week 2 is far better for FCS teams as they will play 38 FBS opponents and ensure the streak of at least 1 win against the FBS every year since the 1978 split stays intact.
Stat Nuggets
Let’s get the bad stats out of the way first. Portland State was crushed 81-7 by Oregon and that amount of points surrendered is in rarified air. Only 5 FCS-FBS games have ever had 81+ points scored by one team and, as expected, none of those were by the FCS. It is one of the unfortunate aspects of the FCS-FBS matchup that does happen from time to time. 80 or more points is extremely rare: it’s only occurred in 0.25% of the games going back to 1978.
Per Game Stats

Weekly Records
Below is a table that shows how each FCS conference performed during the week against FBS foes. There is also the year-to-date record provided in the last column.
| Conference | Games | Week 1 Record | Season-to-Date Record |
|---|---|---|---|
| Big Sky | 3 | 0-3 | 0-3 |
| Big South | 3 | 0-3 | 0-3 |
| CAA | 7 | 0-7 | 0-7 |
| Independents | 0 | 0-0 | 0-0 |
| Ivy League | 0 | 0-0 | 0-0 |
| MEAC | 2 | 0-2 | 0-2 |
| MVFC | 4 | 0-4 | 0-4 |
| NEC | 2 | 0-2 | 0-2 |
| OVC | 3 | 0-3 | 0-3 |
| Patriot League | 2 | 0-2 | 0-2 |
| Pioneer | 0 | 0-0 | 0-0 |
| SoCon | 5 | 0-5 | 0-5 |
| Southland | 3 | 0-3 | 0-3 |
| SWAC | 4 | 0-4 | 0-4 |
| United Athletic | 4 | 0-4 | 0-4 |
Points Scored
Total Yards
Passing Yards
Rushing Yards
Completion Percentage
Yards Per Carry
Turnovers
First Downs
Penalty Yards
3rd Down Efficiency
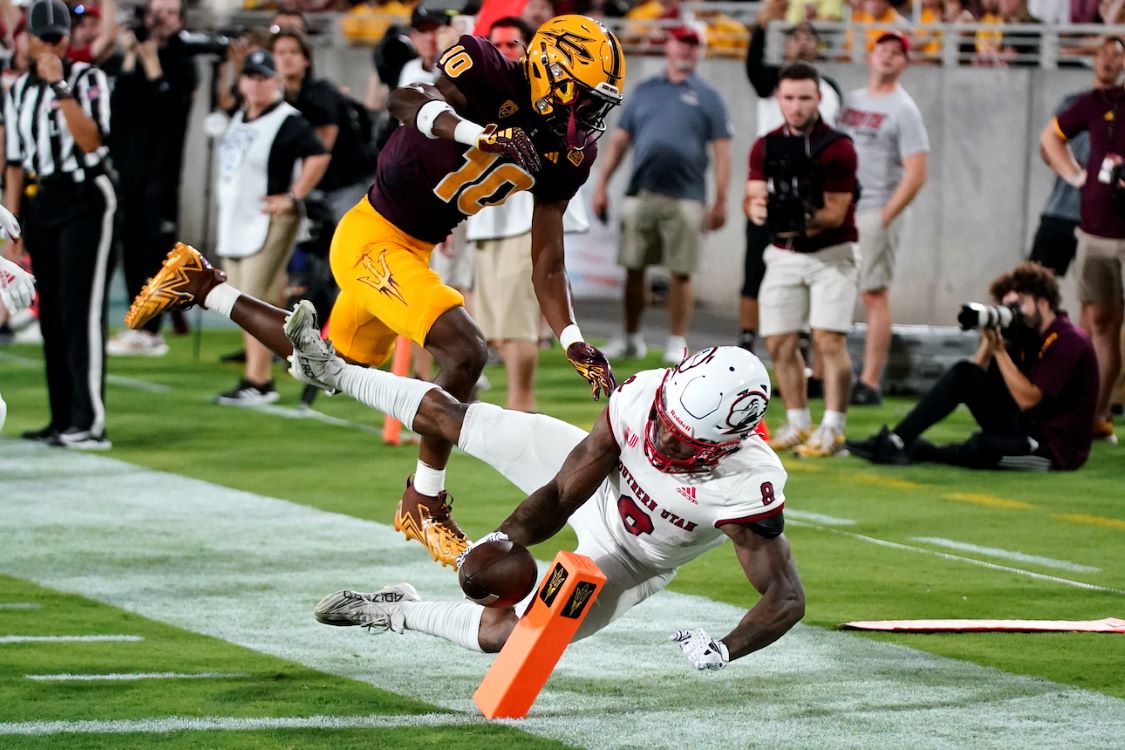
Photo credit to Ross Franklin / Associated Press