Welcome back to Fear The FCS, where a descent into FCS Playoff history has begun. Part one looked at the entirety of the FCS playoffs and this second part of a five-part series will focus on a much narrower time frame of 1978 through 1992. Subsequent entries will dive into later eras with a conclusion comparing the different eras as defined in the series breakdown below. It is highly recommended that part one be reviewed to explain some of the methodology and measures chosen in this analysis. A brief history of the subdivision’s changes from 1978 through 1992 will be reviewed.
Part 5 – Conclusion and Addendum
A Subdivision is Created
The NCAA voted to split its membership in two beginning with the 1978-79 academic year, which led to the creation of two subdivisions: I-A and I-AA. The first two years of the I-AA subdivision had just over 40 members and the low membership total kept the playoff bracket size to only four schools. In 1981, the membership reached 50 and led to an 8-team bracket. A year later in 1982, the bracket expanded again to 12 teams to accommodate the 30+ new members in the I-AA that season. By 1985, there were over 90 teams, which paved the way for another bracket expansion in 1986 to 16 teams.
During the first years of the subdivision, the number of conferences was on the lower side due to fewer teams. There were only five conferences plus independents for the first three seasons. By 1982, that number doubled to 10 (plus independents) following the mass shift of the Ivy League, Missouri Valley (not to be confused with the modern-day Missouri Valley Football Conference), the Southern Conference, and Southland Conference all reclassifying from I-A to I-AA.
By the time 1992 rolled around, the number of conferences was still at 10 plus the 11 independent teams. While a team opting to be independent is a rarity now, it was more commonplace before the turn of the millennium. From 1978 through 1992, the average number of independents each season was above 12 teams. The independents wouldn’t see a membership number below double digits until the 2002 season.
Measure #1 – Margin of Victory
The early years of the then I-AA playoffs saw some of the biggest swings in a majority of categories by virtue of there being fewer games. In the chart below, the margin of victory for a corresponding year is shown in green while the running average margin of victory (all FCS playoff games between 1978 up to and including the 1992 season) is shown in burnt orange. A solid purple line is also included, which represents the average of all games during the 1978 through 1992 era. The second chart shows the average margin of victory for each round.
The average margin of victory in playoff games between 1978 and 1992 was 14.6 points with 1980 having the lowest margin of victory on record at 3.3 points per game. The big caveat for 1980 was that only 3 playoff games were played. There was a noticeable change in the margin of victory starting in 1986 when the playoffs expanded to 16 teams. The margin of victory was 12.7 points in 1985 and by 1992 that increased to 14.6. Furthermore, the Round of 16 and quarterfinals both saw relatively more blowouts with nearly identical margins of victory.
Measure #2 – Road versus Home and Worse Seeds versus Better Seeds
The early era of I-AA football was naturally some of the more competitive given the novelty of the subdivision and the similar resources of the teams involved. For home teams, this meant a slightly worse record overall relative to the historical average (72%) as shown in the charts below. Looking at each round shows a higher-than-average win rate in the quarterfinals but a comparatively worse record in the semifinals.
As noted in part one, home teams have a distinct advantage in the FCS playoffs with a win rate of 72%. That trend wasn’t as strong in the early years with road teams performing better than the historical average. In fact, the average margin of victory for road teams wasn’t far off from the home team’s average margin of victory. The trends are as expected: home teams do better overall and the margin of victory decreases further in the playoffs. The playoff games featuring unseeded teams were the most favorable situation for road teams as they won a shade under 40% of those matchups.
Measure #3 – Conference Composition in the Later Rounds
One of the difficult things about comparing across eras is the different playoff formats used although this analysis does its best to standardize each round across formats. The early years had fewer games in the playoffs due to fewer teams and conferences in the newly established subdivision. This era led to a strange quirk in 1985 when the first round (standardized to the equivalent of a Round of 16) produced 6 conferences represented but the quarterfinals actually had 7 conferences represented thanks to the byes involved. Overall, maximum participation increased in subsequent rounds, following a similar trend noticed in the entire 1978 through 2023 timeframe.
Measure #4 – Which Conferences Made it Further in the Playoffs?
Generally speaking, all conferences were well represented in the final three rounds of the playoffs from 1978 through 1992. The FCS independents led the way thanks to teams like Georgia Southern and Youngstown State before they moved into conferences later in the 1990s. Removing the independent teams, four conferences vied for I-AA supremacy: Big Sky, Ohio Valley, Southern, and Southland. No other conference was close in terms of total appearances in the final three rounds
Conclusion for the 1978 – 1992 Era
The flaws discussed in part one apply to this era and are compounded by a small sample size. Only 165 playoff games comprised this early era, which is reflective of the small membership the subdivision faced early on. By 1985, the number of conferences and teams had stabilized to the point the NCAA felt expanding the playoff bracket to 16 teams was necessary. Nevertheless, small sample sizes can produce wild variance as noticed on the first margin of victory chart, which went from 15 points in 1979 to 3.3 points in 1980 and back to 16.7 in 1981. This type of movement is not exclusive to this era as will be shown in subsequent parts of this series.
Overall, the first era from 1978 – 1992 had its issues but was generally competitive compared to later eras. In terms of the national championship, 13 different conferences had a team participate in the playoffs and 8 made at least one title game appearance. One of those conferences – the SIAC – had an appearance because of Florida A&M in 1978. The Rattlers petitioned the NCAA to allow them to be classified as I-AA and won but still played its games as a member of the SIAC. That fact is a microcosm of the early I-AA/FCS subdivision: the teams were relatively similar in resources in the beginning but as time went on, things would change.
Join us next time for part 3 as we turn the page and look at the playoffs from 1993 through the end of the 16-team era in 2009.
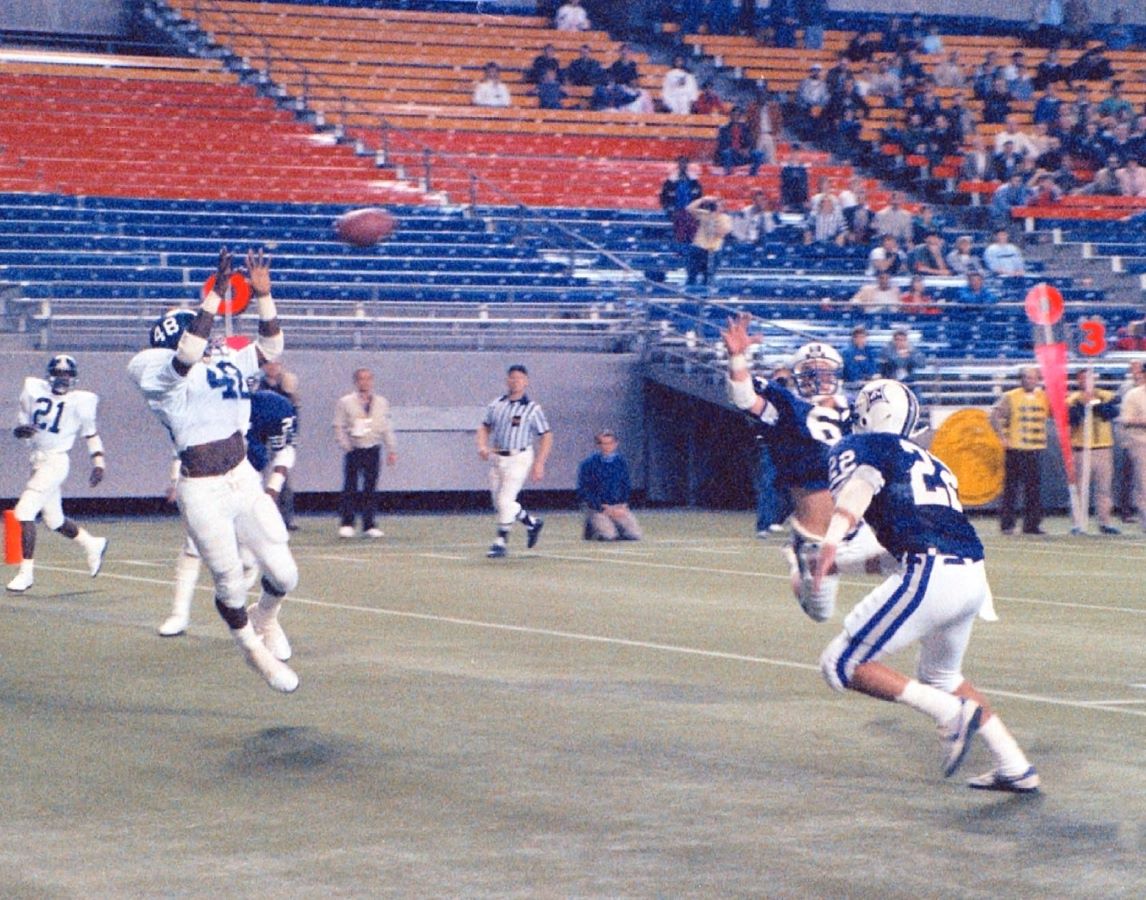
Photo Credit Georgia Southern University Athletics