Welcome back to the fifth edition of the FCS-FBS recap for the 2023 season. The previous editions can be found here. With the FCS versus FBS matchups slowing down drastically around this time of the season, we have combined weeks five and six into one post. The same format will be applied for weeks 10, 11, and 12.
Any insights or nuggets of information will be in the opening paragraphs followed by the charts of each statistical category. The table below allows the user to skip to a specific category instead of scrolling through the charts. All the graphs below will have the same color scheme as FCS teams in orange and FBS teams in blue.
FCS Wins
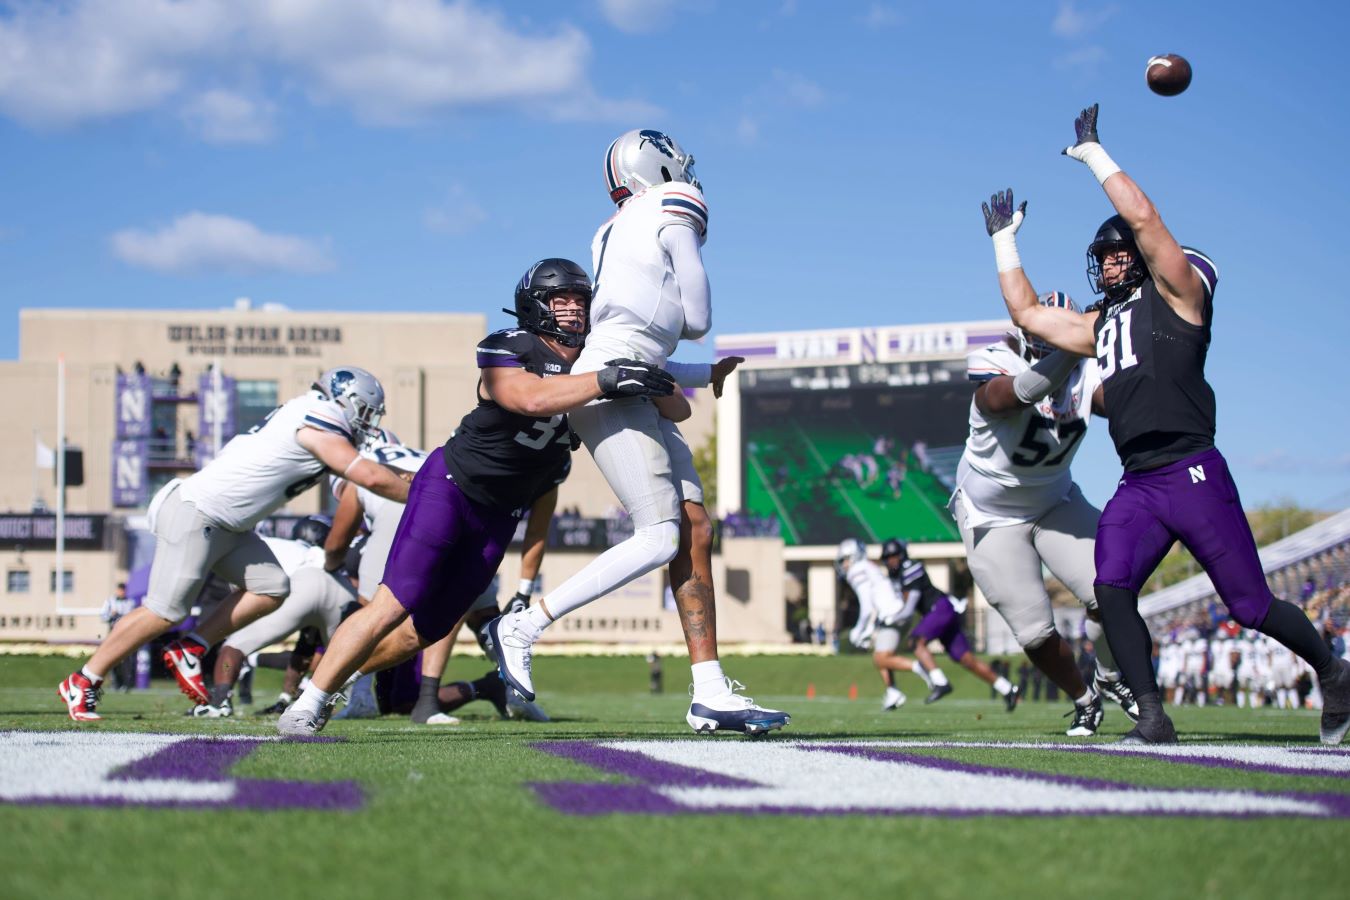
There were no FCS wins in weeks five and six although Howard came close but fell short 23-20 against Northwestern in week six.
Stat Nuggets
Howard’s 23-20 loss against Northwestern was the school’s best performance against a Power 5 conference and it was the MEAC’s closest loss to the Big Ten going back to the 1978 Division I split. William & Mary completed 74% (17 of 26) of its passes against Virginia was the second-best completion percentage in FCS versus FBS games behind Robert Morris‘ 75% (18 of 24) versus Air Force. Since 2018, 18 FCS teams have thrown 74% or better but have only won 2 of those 18 games.
Per Game Stats (Year-To-Date)
The per-game stats for all FCS-FBS games are provided below. The chart shows all 2023 games through week 6 (110 games).

Weekly Records
Below is a table that shows how each FCS conference performed the last two weeks against FBS foes. In addition, each previous week is provided along with the season-to-date record in the last column.
| Conference | Games | Week 1 Record | Week 2 Record | Week 3 Record | Week 4 Record | Week 5 Record | Week 6 Record | Season-to-Date Record |
|---|---|---|---|---|---|---|---|---|
| Big Sky | 13 | 0-3 | 1-5 | 1-3 | 0-0 | 0-0 | 0-0 | 2-11 |
| Big South | 5 | 0-3 | 0-1 | 0-0 | 0-1 | 0-0 | 0-0 | 0-5 |
| CAA | 14 | 0-7 | 0-4 | 0-2 | 0-0 | 0-0 | 0-1 | 0-14 |
| Independents | 0 | 0-0 | 0-0 | 0-0 | 0-0 | 0-0 | 0-0 | 0-0 |
| Ivy League | 0 | 0-0 | 0-0 | 0-0 | 0-0 | 0-0 | 0-0 | 0-0 |
| MEAC | 9 | 0-2 | 0-3 | 0-2 | 0-1 | 0-0 | 0-1 | 0-9 |
| MVFC | 11 | 0-4 | 1-3 | 0-3 | 0-0 | 0-0 | 0-0 | 1-10 |
| NEC | 8 | 0-2 | 0-2 | 0-3 | 0-0 | 0-1 | 0-0 | 0-8 |
| OVC | 5 | 0-3 | 0-2 | 0-0 | 0-0 | 0-0 | 0-0 | 0-5 |
| Patriot League | 5 | 0-2 | 1-2 | 0-0 | 0-0 | 0-0 | 0-0 | 1-4 |
| Pioneer | 0 | 0-0 | 0-0 | 0-0 | 0-0 | 0-0 | 0-0 | 0-0 |
| SoCon | 8 | 0-5 | 0-1 | 0-2 | 0-0 | 0-0 | 0-0 | 0-8 |
| Southland | 11 | 0-3 | 0-6 | 0-0 | 0-2 | 0-0 | 0-0 | 0-11 |
| SWAC | 11 | 0-4 | 0-3 | 0-4 | 0-0 | 0-0 | 0-0 | 0-11 |
| United Athletic | 10 | 0-4 | 0-3 | 0-1 | 0-0 | 0-2 | 0-0 | 0-10 |
| Totals | 110 | 0-42 | 3-35 | 1-20 | 0-4 | 0-3 | 0-2 | 4-106 |
Points Scored
Total Yards
Passing Yards
Rushing Yards
Completion Percentage
Yards Per Carry
Turnovers
First Downs
Penalty Yards
3rd Down Efficiency
Photo credit to Northwestern University Athletics