Welcome back to the fourth edition of the FCS-FBS recap for the 2023 season. It was a much quieter week compared to the first three weeks with only 4 games played between FCS and FBS teams. The previous weekly recaps for week 1, week 2, and week 3 are linked here.
Any insights or nuggets of information will be in the opening paragraphs followed by the charts of each statistical category. The table below allows the user to skip to a specific category instead of having to scroll through the tables. All the graphs below will have the same color scheme as FCS teams in orange and FBS teams in blue.
FCS Wins
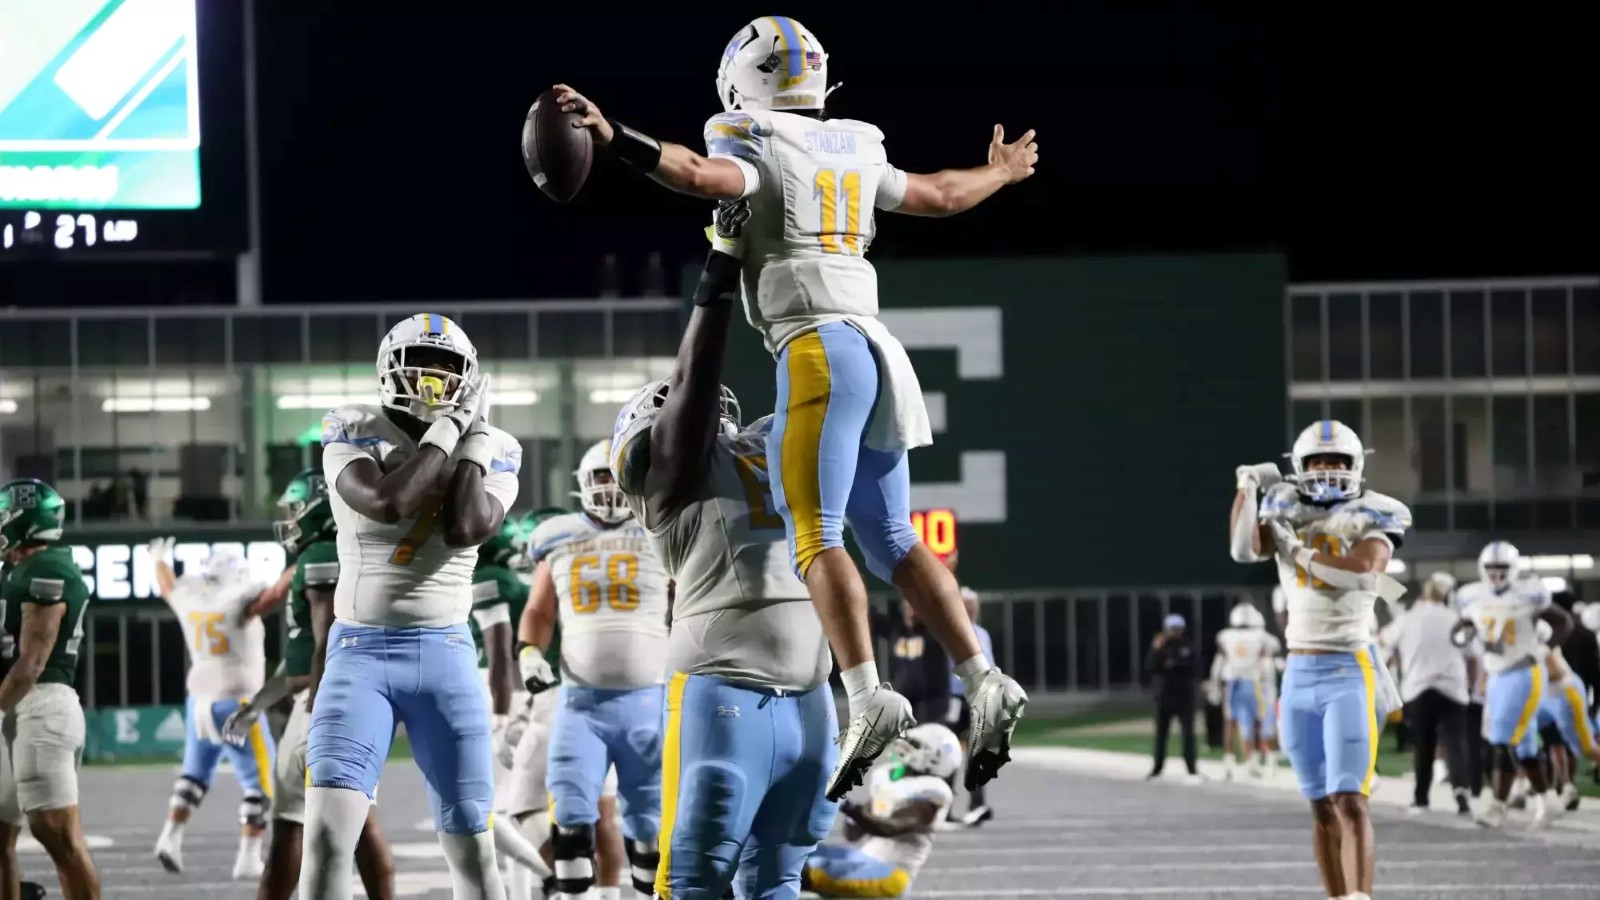
There were no FCS over FBS wins in the four matchups played but Texas A&M-Commerce did play an incredibly close game losing 10-9 to Old Dominion. The Lions played for the win in its FCS-FBS debut going for two after scoring a late touchdown but their pass was intercepted and ODU held on for the win. The 4 FCS over FBS wins in 2023 is the fifth fewest since the Division I split in 1978. There are 13 more FCS-FBS matchups left this year.
Stat Nuggets
Texas A&M-Commerce’s 10-9 loss was an interesting one because the Lions won the turnover battle 5 to 1. Going back to 2018, only four FCS teams have recorded a turnover differential of 4 or higher. In all four games, the FCS team lost and three of those were by single digits. Commerce’s defense had an excellent game in other areas as well. They allowed only 15 rushing yards, which is the third-lowest amount going back to 2018. The other two games also occurred this year (Morgan State allowed 8 rushing yards against Akron and Maine allowed 13 rushing yards versus Florida International).
On the other side of the spectrum, Delaware State had a rough day on defense. They allowed 10.8 yards per carry against Miami (OH), which is the fourth-highest amount since 2018. Averaging more than a first down per carry is a rare occurrence since 2018: only 8 games have seen FBS teams average 10+ yards per carry (no FCS team has been able to hit 10 YPC).
Per Game Stats (Year-To-Date and Week 4)
The per-game stats for all FCS-FBS games are provided below. The first chart is only for the week 4 games (4) while the second chart is for all 2023 games to date (105 games).

Weekly Records
Below is a table that shows how each FCS conference performed during the week against FBS foes. In addition, each previous week is provided along with the season-to-date record in the last column.
| Conference | Games | Week 1 Record | Week 2 Record | Week 3 Record | Week 4 Record | Season-to-Date Record |
|---|---|---|---|---|---|---|
| Big Sky | 13 | 0-3 | 1-5 | 1-3 | 0-0 | 2-11 |
| Big South | 5 | 0-3 | 0-1 | 0-0 | 0-1 | 0-5 |
| CAA | 13 | 0-7 | 0-4 | 0-2 | 0-0 | 0-13 |
| Independents | 0 | 0-0 | 0-0 | 0-0 | 0-0 | 0-0 |
| Ivy League | 0 | 0-0 | 0-0 | 0-0 | 0-0 | 0-0 |
| MEAC | 8 | 0-2 | 0-3 | 0-2 | 0-1 | 0-8 |
| MVFC | 11 | 0-4 | 1-3 | 0-3 | 0-0 | 1-10 |
| NEC | 7 | 0-2 | 0-2 | 0-3 | 0-0 | 0-7 |
| OVC | 5 | 0-3 | 0-2 | 0-0 | 0-0 | 0-5 |
| Patriot League | 5 | 0-2 | 1-2 | 0-0 | 0-0 | 1-4 |
| Pioneer | 0 | 0-0 | 0-0 | 0-0 | 0-0 | 0-0 |
| SoCon | 8 | 0-5 | 0-1 | 0-2 | 0-0 | 0-8 |
| Southland | 11 | 0-3 | 0-6 | 0-0 | 0-2 | 0-11 |
| SWAC | 11 | 0-4 | 0-3 | 0-4 | 0-0 | 0-11 |
| United Athletic | 8 | 0-4 | 0-3 | 0-1 | 0-0 | 0-8 |
| Totals | 105 | 0-42 | 3-35 | 1-20 | 0-4 | 4-101 |
Points Scored
Total Yards
Passing Yards
Rushing Yards
Completion Percentage
Yards Per Carry
Turnovers
First Downs
Penalty Yards
3rd Down Efficiency
Photo Credit to Texas A&M University-Commerce Athletics