The 2023 FCS season has finished so let’s take a look back at how the FCS teams performed against the FBS across all 118 matchups in 2023. The FCS finished the season with 4 victories against the FBS teams, which is the lowest amount since 2019 when the FCS won only 3 matchups. There will be one more review comparing how each FCS conference performed against the FBS.
Any insights or nuggets of information will be in the opening paragraphs followed by a chart that contains each statistical category. All the graphs below will have the same color scheme with FCS teams in orange and FBS teams in blue. Different categories can be selected at the top of the chart and are sorted based on the FCS values.
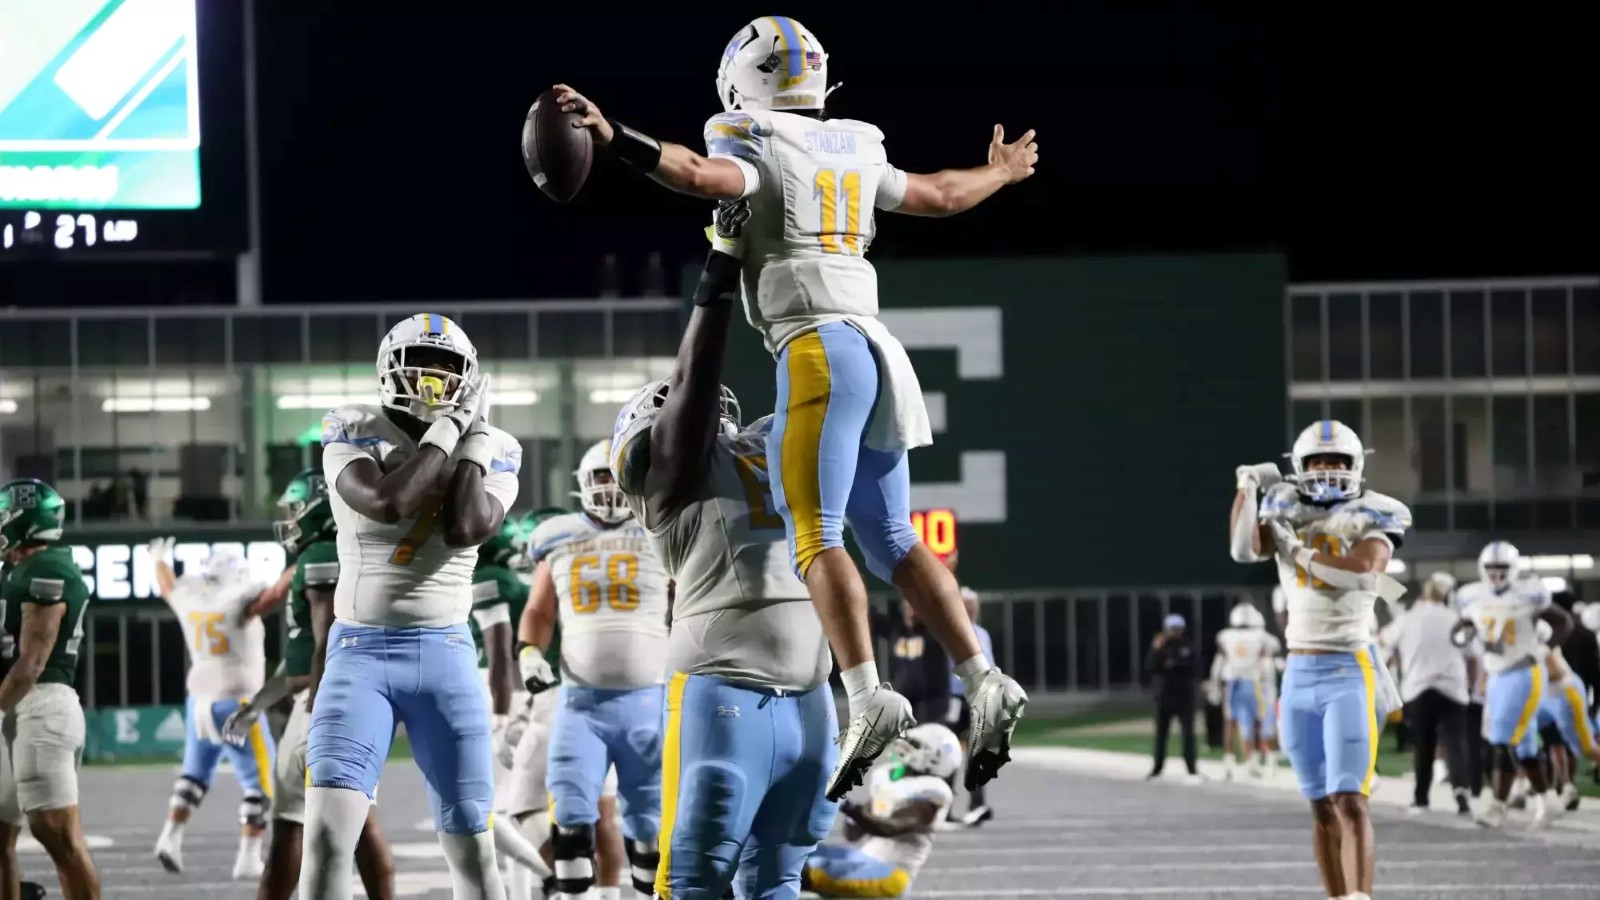
4 FCS Wins
There were 4 FCS wins in 2023, which was half the 2022 total. A year-by-year list of FCS wins and a graph going back to 1978 can be found here. The 4 FCS over FBS wins from 2023 are listed below.
- September 9: Southern Illinois @ Northern Illinois, 14-11
- September 9: Fordham @ Buffalo, 40-37
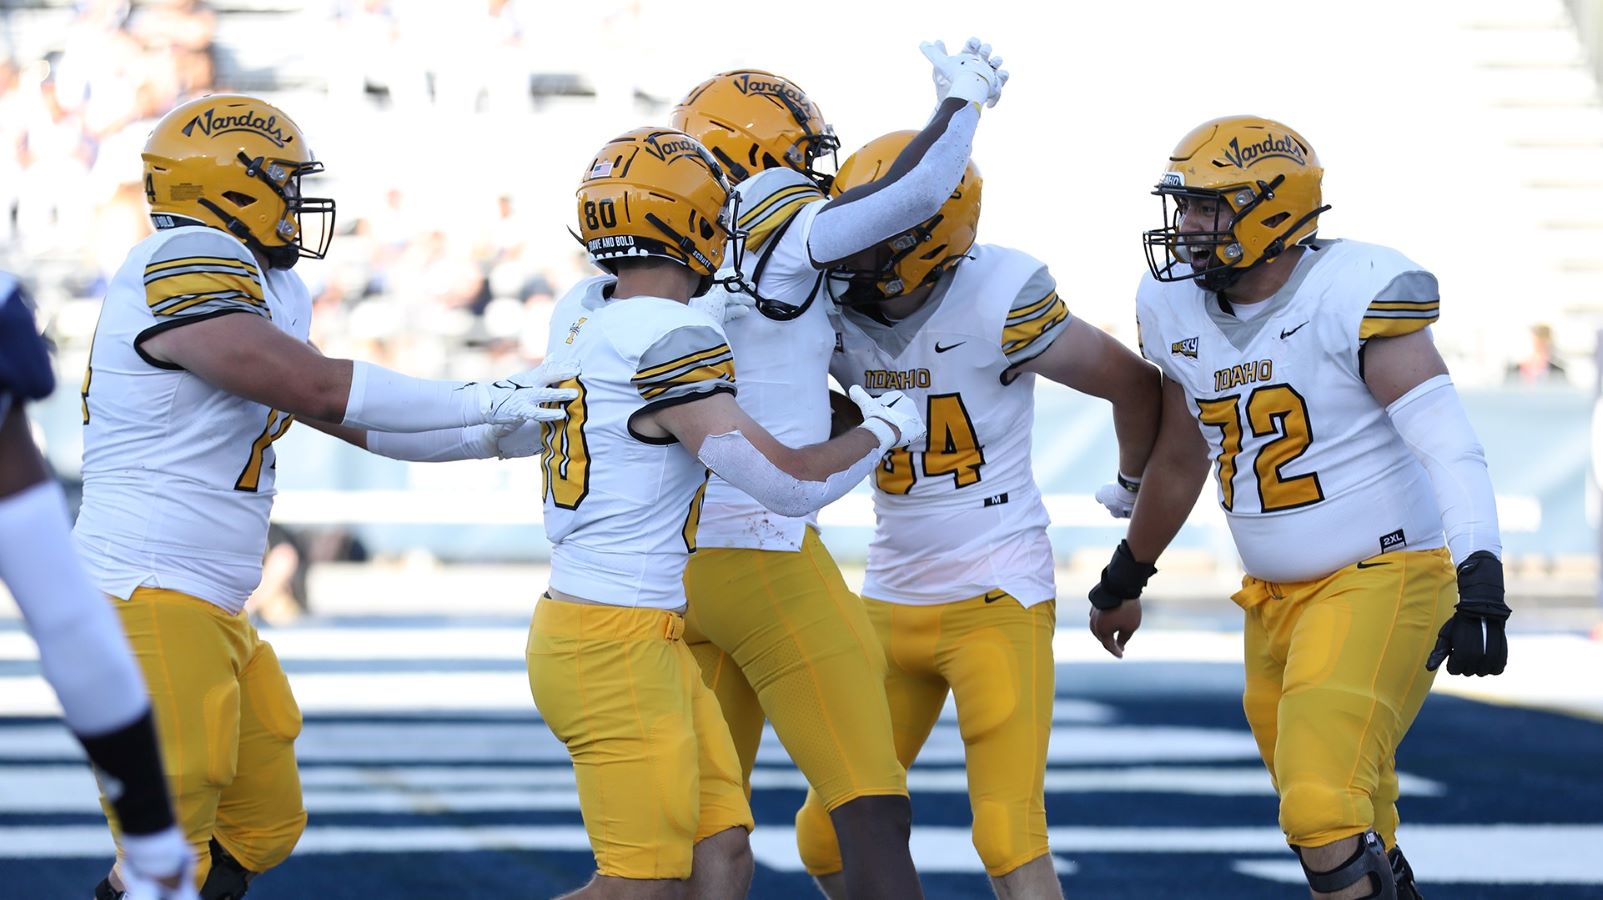
- September 9: Idaho @ Nevada, 33-6
- September 16: Sacramento State @ Stanford, 30-23
Stats Nuggets and Annual Trends
Despite the new timing rules in place for 2023, there was no obvious impact on the FCS-FBS matchups based on the major statistical categories collected. Points were down slightly as were total yards but were on par with the 2021 numbers when the new rules were not in place.
In the 2022 FCS Versus FBS Matchups in Review, we noted that FCS teams struggled to score points and that trend has continued. The FCS averaged only 13.3 points per game while giving up 42.9 points per game. The average scoring difference was 29.6 points per game, which is the fourth-worst differential going back to 1978. The three worst years are 2018 (31.1 points), 2015 (30.7 points), and 2022 (30.3 points). The historical average for scoring difference from 1978 through 2023 is 22.4 with the FCS averaging 15 points per game against the FBS’ 37.4 points per game.
One worrying trend from a competitive standpoint is the number of high-scoring games by the FBS team. The number of 60-point games by the FBS team has increased drastically since the turn of the century. From 1978 through 2000, there were 40 games in which the FBS teams scored 60 or more points, which is about 2.9% of the games played. From 2001 through 2023, that number has skyrocketed to 258, which is 12.3% of the games played.
Even adjusting for the increase in the number of FCS-FBS matchups doesn’t make this particular trend look any better. There were 53% more games played between 2001 through 2023 compared to 1978 through 2000. That increase would translate to an expected average of roughly 4.5% but the 2001 through 2023 level is nearly triple that. The trend became more pronounced beginning in 2010. No season has had fewer than 10 games in which the FBS team dropped 60 points except for the 2020 COVID season. On top of that, of the 298 that have happened since the Division I split in 1978, 207 have occurred since 2010 (70% of all occurrences).
There are other reasons for the uptick outside the higher frequency of FCS-FBS matchups. The biggest reason is the rule changes that have been favorable to offenses and the increased use of the spread formation. It’s never been easier to score points in college football so it makes sense that the FBS teams would score more points in the current era. Compounding those factors, FBS teams have 22 more scholarships available than a majority of FCS teams, which makes it easier for FBS teams to score points given the easier nature of recruiting higher-level talent at the FBS level.
2023 FCS Versus FBS Per Game Stats
Below is a bar chart showing the averages of most statistical categories across all 118 FCS versus FBS games in 2023. The bar chart below is normalized to 100% and the numbers on each bar represent the FCS and FBS averages for all matchups in 2023. FBS is shown in blue and FCS is in orange.

Weekly Records
Below is a table that shows how each FCS conference performed against FBS foes with weekly records provided.
| Conference | Games | 2023 Record | Week 1 | Week 2 | Week 3 | Week 4 | Week 5 | Week 6 | Week 10 | Week 11 | Week 12 | |
|---|---|---|---|---|---|---|---|---|---|---|---|---|
| Big Sky | 13 | 2-11 | 0-3 | 1-5 | 1-3 | 0-0 | 0-0 | 0-0 | 0-0 | 0-0 | 0-0 | |
| Big South-OVC | 10 | 0-10 | 0-6 | 0-3 | 0-0 | 0-1 | 0-0 | 0-0 | 0-0 | 0-0 | 0-0 | |
| CAA | 15 | 0-15 | 0-7 | 0-4 | 0-2 | 0-0 | 0-0 | 0-1 | 0-1 | 0-0 | 0-0 | |
| Independents | 1 | 0-1 | 0-0 | 0-0 | 0-0 | 0-0 | 0-0 | 0-0 | 0-1 | 0-0 | 0-0 | |
| Ivy League | 0 | 0-0 | 0-0 | 0-0 | 0-0 | 0-0 | 0-0 | 0-0 | 0-0 | 0-0 | 0-0 | |
| MEAC | 9 | 0-9 | 0-2 | 0-3 | 0-2 | 0-1 | 0-0 | 0-1 | 0-0 | 0-0 | 0-0 | |
| MVFC | 11 | 1-10 | 0-4 | 1-3 | 0-3 | 0-0 | 0-0 | 0-0 | 0-0 | 0-0 | 0-0 | |
| NEC | 10 | 0-10 | 0-2 | 0-2 | 0-3 | 0-0 | 0-1 | 0-0 | 0-1 | 0-0 | 0-1 | |
| Patriot League | 6 | 1-5 | 0-2 | 1-2 | 0-0 | 0-0 | 0-0 | 0-0 | 0-0 | 0-1 | 0-0 | |
| Pioneer | 0 | 0-0 | 0-0 | 0-0 | 0-0 | 0-0 | 0-0 | 0-0 | 0-0 | 0-0 | 0-0 | |
| SoCon | 9 | 0-9 | 0-5 | 0-1 | 0-2 | 0-0 | 0-0 | 0-0 | 0-0 | 0-0 | 0-1 | |
| Southland | 11 | 0-11 | 0-3 | 0-6 | 0-0 | 0-2 | 0-0 | 0-0 | 0-0 | 0-0 | 0-0 | |
| SWAC | 11 | 0-11 | 0-4 | 0-3 | 0-4 | 0-0 | 0-0 | 0-0 | 0-0 | 0-0 | 0-0 | |
| United Athletic | 12 | 0-12 | 0-4 | 0-3 | 0-1 | 0-0 | 0-2 | 0-0 | 0-0 | 0-0 | 0-2 | |
| Totals | 118 | 4-114 | 0-42 | 3-35 | 1-20 | 0-4 | 0-3 | 0-2 | 0-3 | 0-1 | 0-4 |
Charts
Below is a chart for each of the following statistical categories: points, total yards, passing yards, rushing yards, completion percentage, yards per carry, turnovers, first downs, penalty yards, and third down conversion percentage. The graphic below will show only one category at a time and is sorted by the highest total for the FCS with each matchup (week) shown on the left. In addition, you can choose to select only the FBS teams, FCS teams, or both with FBS teams in blue and FCS teams in orange. Hovering over a bar will give more info, which can be useful if the FBS or FCS data series is selected by itself. Finally, any bar that is missing represents a zero value, which is present in the points, turnovers, and penalty yardage charts.
Photo Credit to the University of Idaho Athletics