Welcome back to the third edition of the FCS-FBS recap for the 2023 season. The week 1 recap can be found here while the week 2 recap is here. We will provide numerous graphs and statistics for the 21 FCS versus FBS matchups played in week three of the college football season.
Any insights or nuggets of information will be in the opening paragraphs followed by the charts of each statistical category. The table below allows the user to skip to a specific category instead of having to scroll through the tables. All the graphs below will have the same color scheme as FCS teams in orange and FBS teams in blue.
FCS Wins
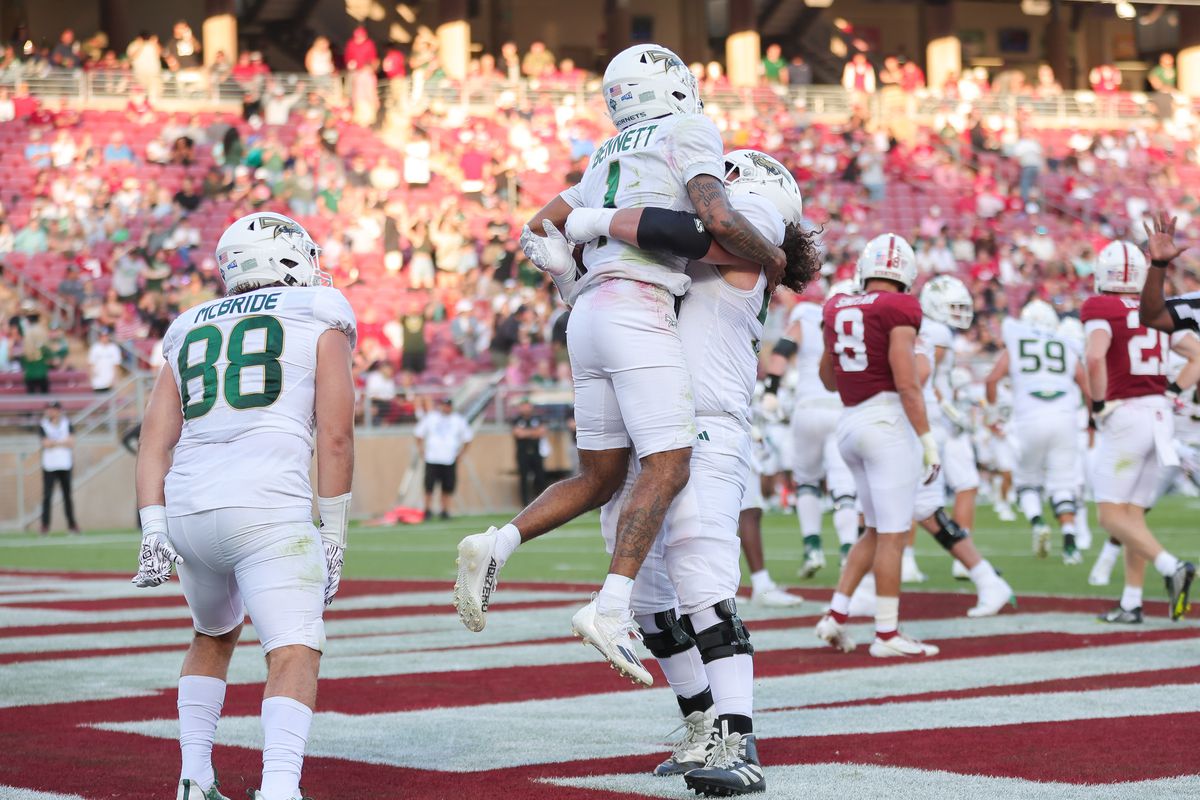
After posting three wins over the FBS in week two, there was only one FCS over FBS win in week three. Sacramento State won 30-23 over Stanford to claim its 4th FCS over FBS win all-time. The Hornets also won last year 41-10 against Colorado State. Of the Hornets’ four wins, three have come against Pac-12 competition with additional wins over Colorado in 2012 and Oregon State in 2011. As for Stanford, it was their second loss to an FCS team with the first occurring in 2005 when they fell to UC Davis 20-17.
Stat Nuggets
Week three was rough for the FCS in most categories. Through games played in week 3, the FCS is getting outscored 43.5 to 13.3 on average, which is the 4th worst point differential since 1978. There are still 17 more FCS-FBS matchups in 2023 for that number to change.
In our recap last week, there was talk about turnovers and that’s back again this week. Sacramento State and Stanford both committed two turnovers apiece, which means neither team won the turnover battle. Of the 29 FCS-FBS wins since 2019, eight have resulted in no turnover difference and only 4 games saw the FCS team lose the turnover battle AND win the game.
Another good omen for FCS teams is having more first downs, which is this week’s “Thanks Captain Obvious” segment. Of the 29 FCS over FBS wins since 2019, 16 games saw the FCS team record more first downs than their FBS opponent. On top of that, three of this year’s 4 FCS over FBS wins have seen the same thing happen. More first downs mean more time is running off the clock (thanks, Captain Obvious). It will be worth watching this specific trend over the next several seasons with the new timing rules adopted for 2023.
Per Game Stats (Year-To-Date and Week 3)
The per-game stats for all FCS-FBS games are provided below. The first chart is only for the week 3 games (21) while the second chart is for all 2023 games to date (101 games).
Weekly Records
Below is a table that shows how each FCS conference performed during the week against FBS foes. There is also the year-to-date record provided in the last column.
| Conference | Games | Week 1 Record | Week 2 Record | Week 3 Record | Season-to-Date Record |
|---|---|---|---|---|---|
| Big Sky | 13 | 0-3 | 1-5 | 1-3 | 2-11 |
| Big South | 4 | 0-3 | 0-1 | 0-0 | 0-4 |
| CAA | 13 | 0-7 | 0-4 | 0-2 | 0-13 |
| Independents | 0 | 0-0 | 0-0 | 0-0 | 0-0 |
| Ivy League | 0 | 0-0 | 0-0 | 0-0 | 0-0 |
| MEAC | 7 | 0-2 | 0-3 | 0-2 | 0-7 |
| MVFC | 11 | 0-4 | 1-3 | 0-3 | 1-10 |
| NEC | 7 | 0-2 | 0-2 | 0-3 | 0-7 |
| OVC | 5 | 0-3 | 0-2 | 0-0 | 0-5 |
| Patriot League | 5 | 0-2 | 1-2 | 0-0 | 1-4 |
| Pioneer | 0 | 0-0 | 0-0 | 0-0 | 0-0 |
| SoCon | 8 | 0-5 | 0-1 | 0-2 | 0-8 |
| Southland | 9 | 0-3 | 0-6 | 0-0 | 0-9 |
| SWAC | 11 | 0-4 | 0-3 | 0-4 | 0-11 |
| United Athletic | 8 | 0-4 | 0-3 | 0-1 | 0-8 |
| Totals | 101 | 0-42 | 3-35 | 1-20 | 4-97 |
Points Scored
Total Yards
Passing Yards
Rushing Yards
Completion Percentage
Yards Per Carry
Turnovers
First Downs
Penalty Yards
3rd Down Efficiency
Photo credit to Sergio Estrada/USA TODAY Sports


